Gas Companion
About this project
This project was done to further improve my understanding of javascript and APIs specifically Google Maps API. This specific application was done because I've noticed that drivers often times drive around town looking for the cheapest gas station which sometimes results in gas stations being crowded on weekends. This solution aims for drivers to easily compare gas prices around them and also provides analytics of each parish.
The Design
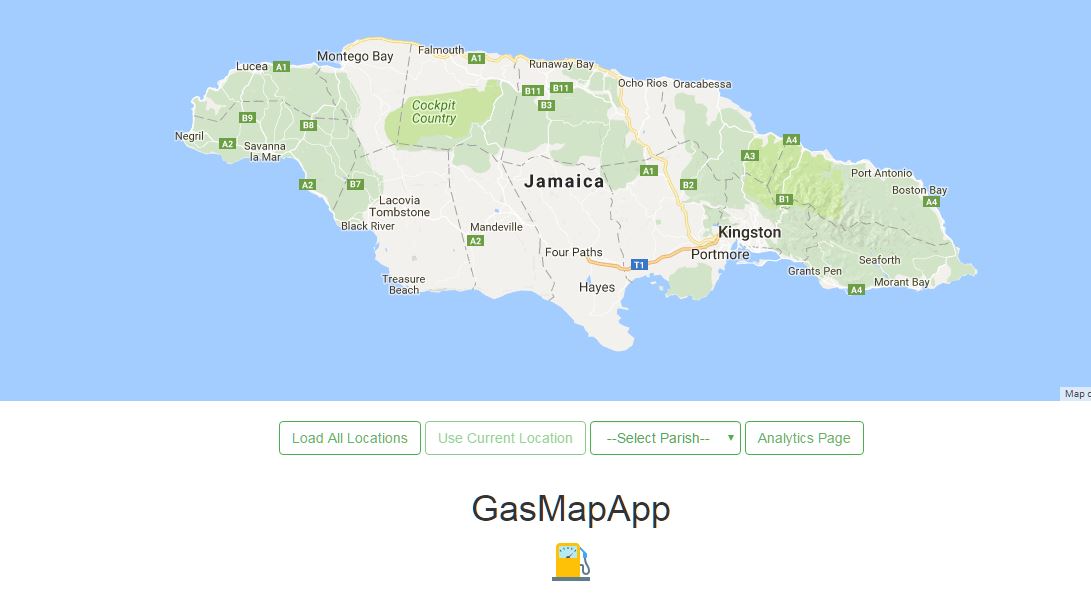
As stated this project was focused on javascript and not the UI, however some thought was given on what the UI should look like. This design approach was considered as it allows for the map to be rendered in a large real estate so users can manipulate the map with ease. The controls do not need as much space as it isn't the main focus showing information, therefore it was placed to the side of the map so users can quickly mouse over to the controls and filter results without taking attention away from the map.

Update (May 12,2017)
After careful consideration I decided that the current design may not have been the best approach, the explanation for the old design still holds true however due to the limited number of buttons the side bar appears empty. Being a fan of minimalism (there is beauty in simplicity) I decided to make it a bit more...simple and I think it works..what do you think?
The Process
1) Where's the data?
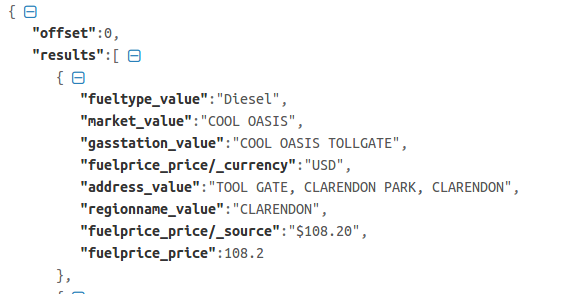
There wasn't any available APIs for this project which made things interesting. After hours (maybe not hours,minutes really) of searching Google for keywords such as "Jamaica" "gas" "prices" & "stations" I stumbled upon a site that had the information I needed in a tabular format. Not exactly what I wanted but it was a step in the right direction.

2) How do I use this?
Now that data was there I needed a way to get this data into my application so I knew I needed to get the format from a HTML table to JSON format (or XML whichever floats ya boat). I could have written a python script to scrape the website and then create an API to return the scraped data in JSON format but I opted to use a service that already did that(why reinvent the wheel). I simply supplied their website with a URL link to the site I found earlier with the tabular data and with a bit of 'magic' an API URL link was generated which returned JSON.
3) Putting you on the map
After adding the Google Maps library to the project it was time to add each (660) gas station marker to the map but there was only one problem, the JSON returned addresses of each gas station whereas google maps is expecting latitude and longitude values. I tackled this problem in two ways:
-
I used the built in google reverse geolocation function to get the latitude and logitude for each gas station after passing in the address to the function. There was however the problem of hitting a query limit after trying to geolocate 660 places (Ooops! Sorry Google). I remedided this by adding a timeout of a couple miliseconds to give Google's servers a break after a query but this still wasn't enough because if the number of gas stations increase the time to query Google also increases (5ms isn't that long but 5ms x 1000+more gas station adds up) so this was scrapped.
-
The way I went with (might have been a lot of manual work but it did the job) was to use an online reverse geolocation service that can take a batch of addresses. I grabbed the address for all the gas stations and gave it to the service which took a while to process my request. It returned a list of latitudes and longitudes. I then created two arrays to hold latitudes and longitudes respectfully, looped through both arrays and added a new latitude and longitude property to the gas station object.
for (i=0;i < lon.length;i++){
    request.results[i].lon=lon[i];
    }
2) X marks the spot
Everything was in place to add markers to the map. It's a simple as looping over each gas station object and grab the latitude and longitude for each using dot notation now that they were added to the object in the previous step.
for(i=0; i< request.results.length; i++){
    lat = parseFloat(request.results[i].lat);
    lon = parseFloat(request.results[i].lon);
    var geocoder = new google.maps.Geocoder();
    var myLatLng = {lat: lat, lng: lon};
2) Filter Filter Filter
A function was created to load only the markers associated with the location that the user selected from the dropdown list. It was rather simple,when the user selects a location that is stored in a variable called value, within the function a conditional statement was created to check what value the user selected and if the gas station's parish value equalled that of the selected value then the latitude and longitude of those gas stations would populate the map. This function is triggered whenever a new value is selected.
for(i=0;i< request.results.length;i++){
    loc.push(request.results[i].regionname_value);
      if(loc[i] == document.getElementById('select').value){

        var parish_lat = parseFloat(request.results[i].lat);
        var parish_long = parseFloat(request.results[i].lon);

        var geocoder = new google.maps.Geocoder();
        var myLatLng = {lat: parish_lat, lng: parish_long};
        var marker = new google.maps.Marker({
        position: myLatLng,
        map: map,
        draggable: false,
          });
  ...
  ...
2) The Analysis Page(WIP)
This page was intended to give users a quick visual representation of information. Bar charts were used to display the highest and lowest gas price for each parish. An alert is then triggered when a user a clicks on either the highest or lowest bar for each parish where an info window pops up giving information about that gas station.

How Its Done
1) MiniMax
So obviously for this to work, the maximum and minimum for each parish (state/province depending on where you're from) was needed. An empty array was created for each parish, all maximum values, all minimum values and a loop was then created to loop over each value where location is equal to the place you want (example location == "Kingston") then from that the maximum values are pushed to the maximum array that holds the maximum values from each parish and the same was done for minimum. Enough talking here is an example
    var sttmax = st_tho[0];
    var sttmaxIndex = 0;
            for (var i = 1; i < st_tho.length; i++) {
                if (st_tho[i] > sttmax) {
                      sttmaxIndex = i;
                      sttmax = st_tho[i];
                                  }
                              }

      var sttmin = st_tho[0];
        var sttminIndex = 0;
            for (var i = 1; i < st_tho.length; i++) {
                if (st_tho[i] < sttmin) {
                    sttminIndex = i;
                    sttmin = st_tho[i];
                                  }
                              }

                              max_data.push(sttmax);
                              min_data.push(sttmin);
2) Clicky Bars
Now when we click on each bar it should alert the corresponding facts about it based on if the value is a maximum or minimum (it will be rare that a gas station has both the maximum and minimum prices for on parish, so the locations alerted should be distinct). This was a bit of a challenge, 2 ways were done
The wrong way- the problem with the snippet is that no matter if the user clicked on the minimum or maximum bar for each parish it would alert the maximum. The problem was I couldn't get access to the minimum bar,activePoints[0] gave the first bar (maximum) so one would assume activePoints[1] would give the minimum bar..wrong not that simple
  var activePoints = myBarChart.getBarsAtEvent(evt);
             if (activePoints[0].value ==kmax) {
                 swal(log);
               } else if (activePoints[0].label == "St.Andrew"){
                   alert("log")
As you can see, no matter what is clicked..the same info comes up
The "correct" way (of course in programming you may have multiple solutions) with the help of digging through stackoverflow - What was done here is, instead of using getBarsAtEvent, getElementsAtEvent was used (duhh!! no wonder the chart was treating each bar as one entitiy instead of individual bars)
var onclickValue = config.data.datasets[firstPoint._datasetIndex].data[firstPoint._index];
was used to grab the value of each bar and once I was getting individual values, I was able to use conditional statements to match back to the maximum and minimum values for each parish and alert the corresponding statements if they match like so
         if (onclickValue == kmax) {
              swal(klog);
           }
         else  if (onclickValue == kmin ) {
               swal(kminlog)
           }
As you can see the info now changes

To Dos:
-
Refactor code
-
Add ability to display gas stations near user's current location
-
Store latitude & longitude of gas stations on back-end instead of through javascript
-
Add bar charts showing highest and lowest gas prices for each brand (i.e Total etc)
-
Investigate some gas station's latitude and longitude values
-
Add another condition to check for parish names incase two parishes share the same maximum or minimum values to avoid alerting the wrong address (example : "&& address == "parish")